
The Role of Vote Splitting in the 1993 Canadian Federal Election
Did a surging Reform Party doom the Progressive Conservatives to a landslide defeat, or were other factors more important?

Countries periodically go through a “realigning” election, meaning one in which the political landscape changes in a dramatic way. This doesn’t necessarily just mean that a political party won or lost in a landslide. Rather, it refers to an election where maps, going forward, are irreversibly changed in a clear way. This could mean that the existing political parties swap bases of support (be it geographic, demographic, or both). It could mean regional issues causing unique behaviours in a specific part of the country, or a new major party emerging which complicates dynamics of the electorate.
It is somewhat unusual for a realigning election to have all of these things happen, and feature one of the worst defeats ever experienced by a governing party in the developed world. This was the case for the 1993 Canadian Federal Election.
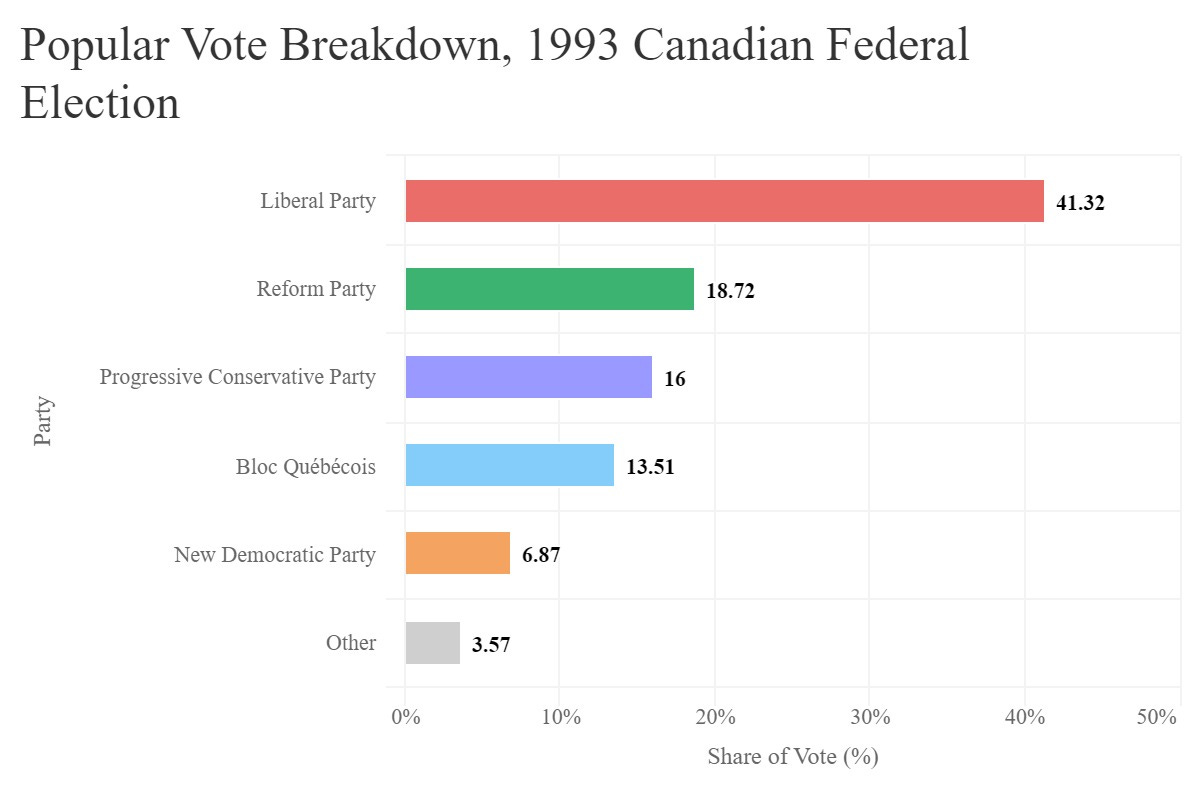
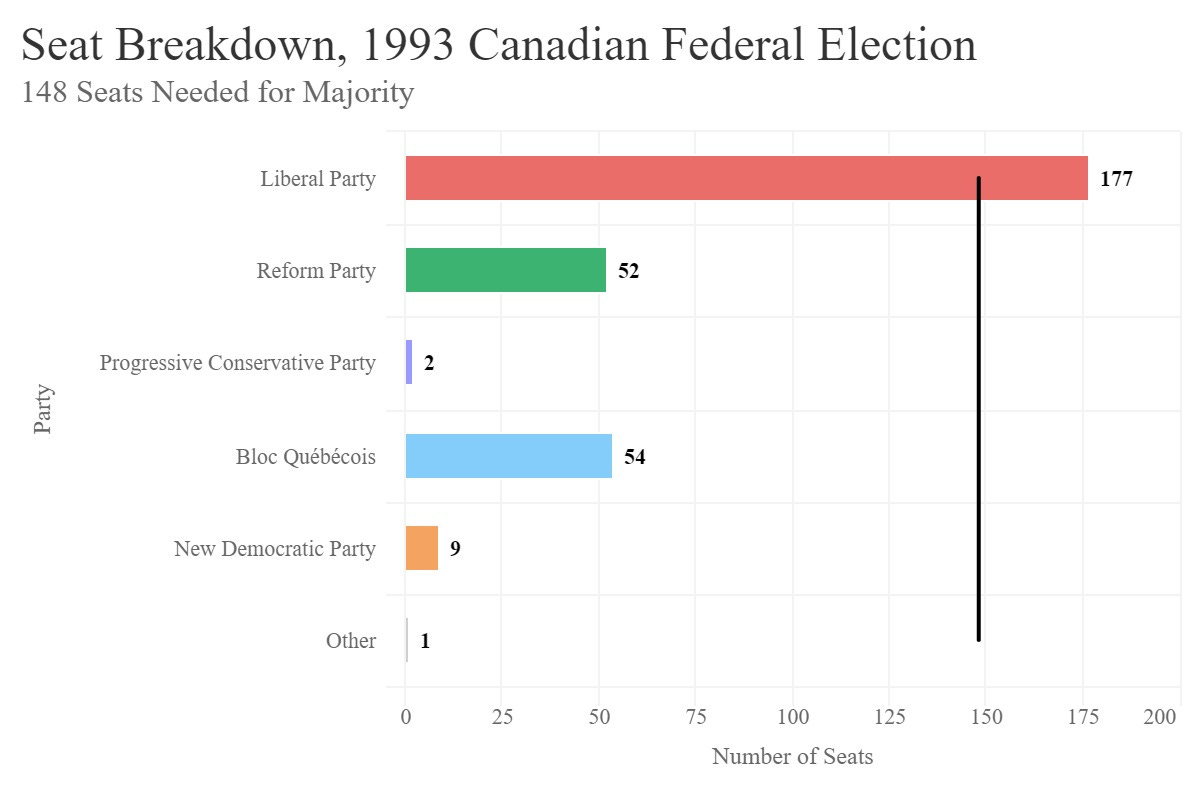
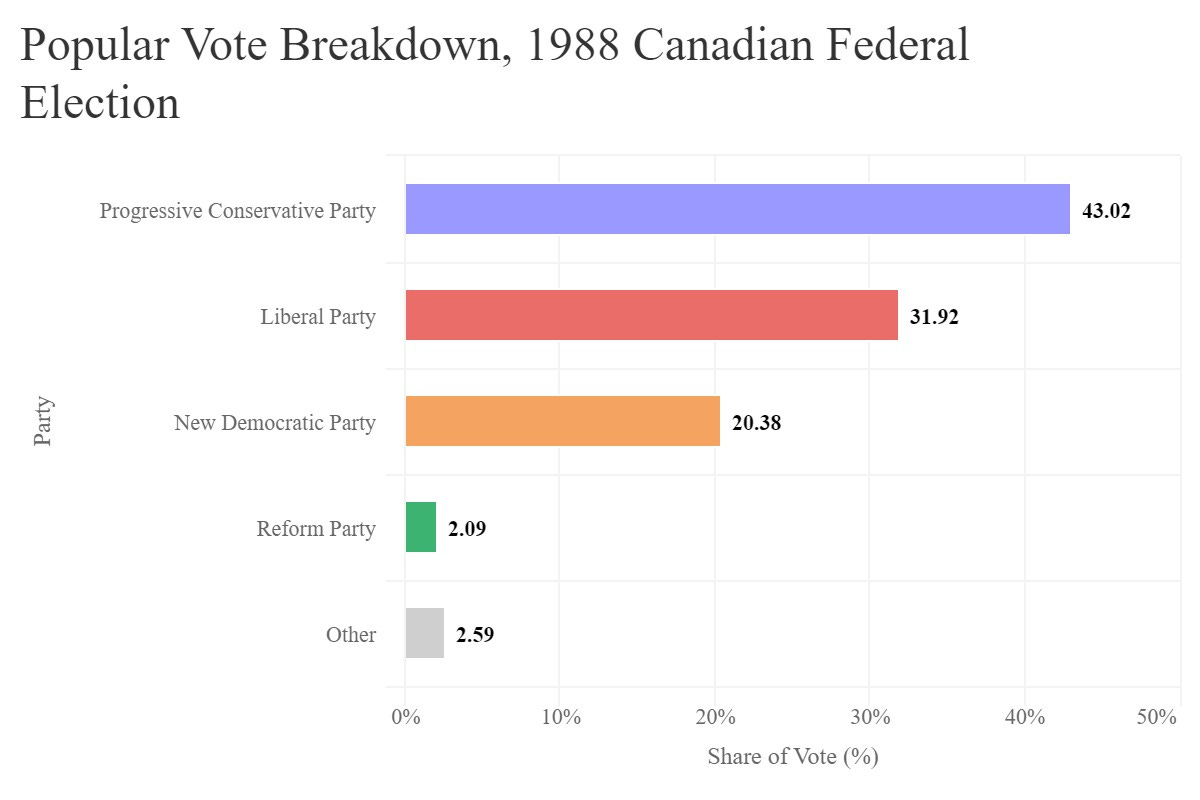
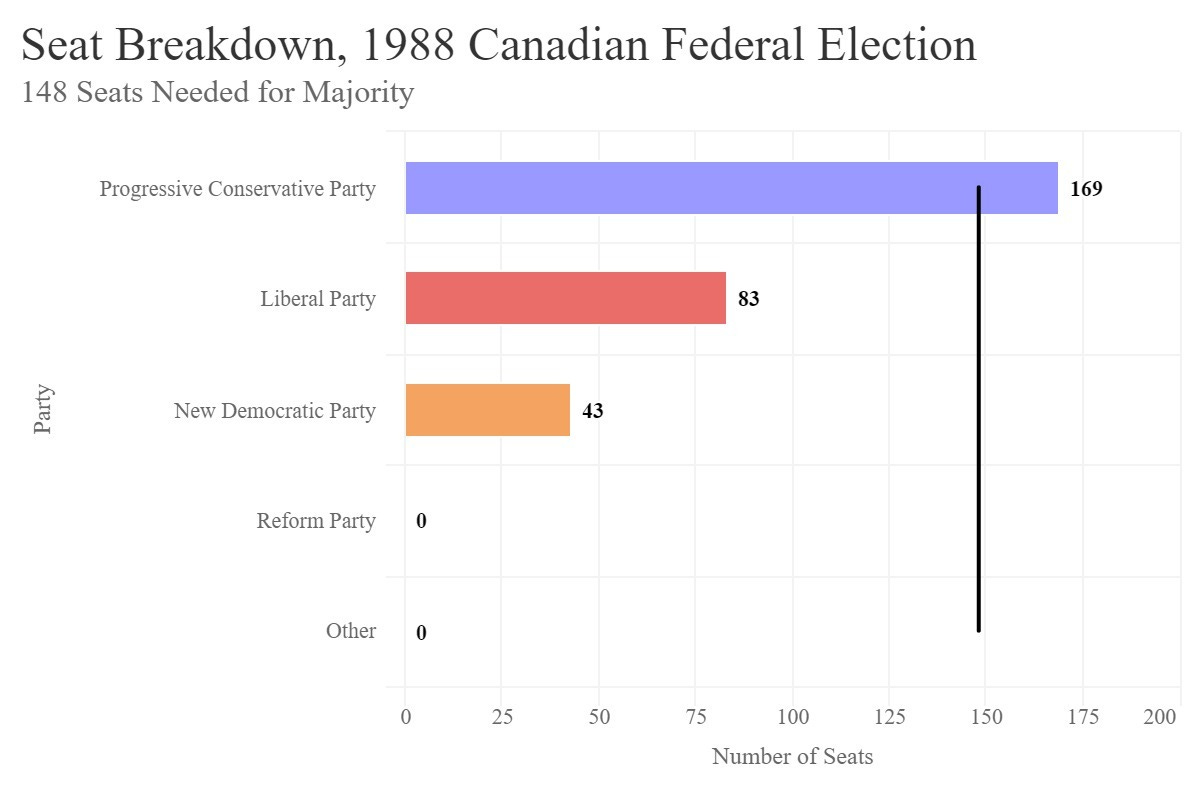
Held on October 25th, 1993, this election saw the ruling Progressive Conservative Party, or PC (led by incumbent Prime Minister Kim Campbell, 122 days on the job), win only two (2) seats, putting them in fifth place (though technically not last place, since an independent MP was also elected in the Québec riding of Beauce). Notably, Kim Campbell was not one of those two MPs, as she lost her seat in the riding of Vancouver Centre. This collapse allowed the Liberal Party to win a clear majority, and made its leader, Jean Chrétien, the first Liberal Prime Minister since 1984. More interesting, however, was the composition of the opposition parties other than the PC. Traditionally, the New Democratic Party, or NDP, had been the most notable third-party in Canada’s post-war era, usually taking third place off of a strong base of support in Western Canada (especially in British Columbia), along with left-wing voters in other parts of the country. Instead, 1993 saw the NDP finish fourth in seats, as Western Canada was dominated by the rise of the right-wing Reform Party (especially in Alberta, which had usually been the PC’s strongest province). While the Reform Party had existed in the previous election, held in 1988, it did not win any seats and received very few votes in the ridings it ran in. This time, however, it not only commanded a surprisingly high level of support, but also replaced the PC as the dominant right of centre party. It did not, however, become the official opposition (typically given to the party with the second-most seats); that title belonged to the newly-formed Bloc Québécois. The Bloc, ideologically committed to Québec Separatism (though not much else), were able to ride a wave of nationalist sentiment in Québec and win 54 of the province’s 75 seats. The inclusion of this many parties in the House of Commons was a significant break from 1988, which was mostly a three-way race.
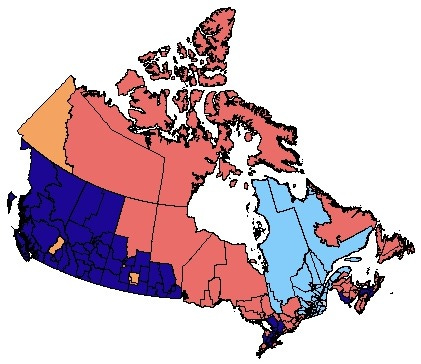
Although the Liberal Party was the clear winner, this election is often remembered as less of a testament to their strength in the campaign, and more to the weakness of the Canadian right at the time. An impressive national result, it is often argued, obscures the fact that in many ridings, the Liberals did not win a majority of the vote, and the combined vote shares of the PC and Reform parties (i.e., the combined right of centre vote) would have defeated the Liberals in a head-to-head race. Looking at the national map of the 1993 election, it’s difficult not to notice the Liberals winning even in some traditionally very conservative parts of the country, such as rural Manitoba and rural Southern Ontario.

Ontario, in particular, is a notable example. The most populous and seat-rich province, Ontario has always been highly targeted by campaigns, with the hopes of flipping large amounts of swing ridings. The 1993 election saw the Liberals so dominant in Ontario that they won all, but one, of the province’s 99 seats. The one exception was Simcoe Centre, which the Reform Party won by a margin of 182 votes.


Along with the argument that split vote with the Reform Party was the primary cause of PC’s loss, retrospectives usually treat the PC’s defeat as an inevitability, with there being very little Kim Campbell could have done to even avoid a wipeout given the circumstances. This type of summary was seen a lot during comparisons with the recent 2024 United Kingdom General Election, with observers noting that the governing Conservative Party were heading for an inevitable wipeout due to their unpopularity, plus a split on their right flank (due to the rise of, coincidentally, Reform UK), making Prime Minister Rishi Sunak a placeholder captain of a sinking ship, much like Kim Campbell.
In this article, I’ll be looking at the actual results by riding of the 1993 election, along with pre- and post-election research and survey data, to answer two questions:
Was split vote between the PC and Reform parties the primary cause for the Liberal Party’s victory (or at least, the primary cause for its majority, rather than plurality, victory)?
Was Kim Campbell’s landslide defeat inevitable, or could she have done significantly better?
Combining the Votes (and Why That’s a Bad Answer)
To determine the impact of split votes, it may seem like the clearest solution is just to combine the PC and Reform vote shares in each riding, and see how many seats the newly combined right-wing vote would win. This approach is incredibly flawed, for the reason that it assumes that every single PC and Reform voter would be willing (and 100% certain) to vote for a newly merged party. The problem with this approach is that these voters chose to vote for either the PC or Reform party because that’s the party they wanted to vote for. It’s impossible to know why they voted that way, and impossible to know if a merged right of centre party would appeal to them in the same way. It’s important to remember that the PC government was very unpopular at this point, and many Reform voters may have been so turned off by the party that in the event of a merger, they would have simply abstained from voting, or possibly even voted for an alternative. Likewise, many PC voters likely stuck with the traditional party of the right because they were skeptical of the relatively new Reform Party, and may have been equally skeptical of a hypothetical merger.
Regardless, to create some sort of baseline to start with, I have calculated the results, by riding, based on a hypothetical combined right of centre vote (i.e., Reform plus PC), while leaving all other parties’ vote shares constant. The results are as follows:
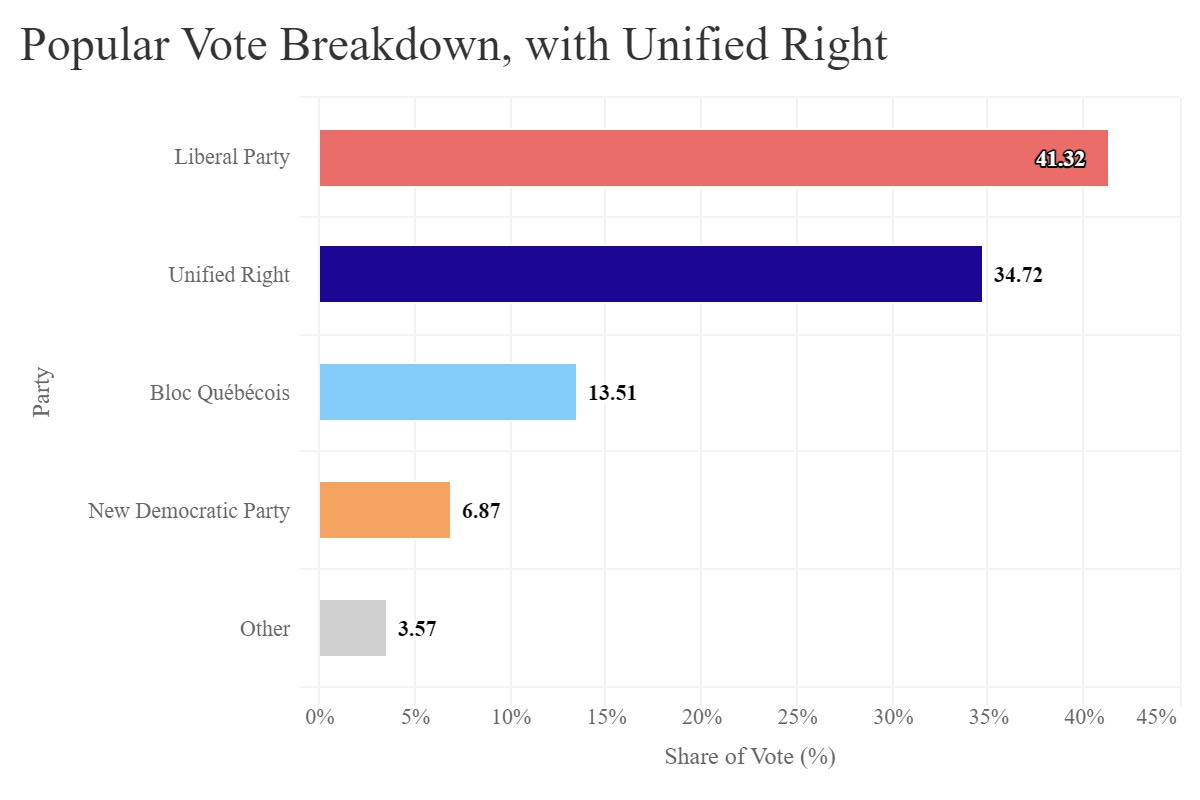
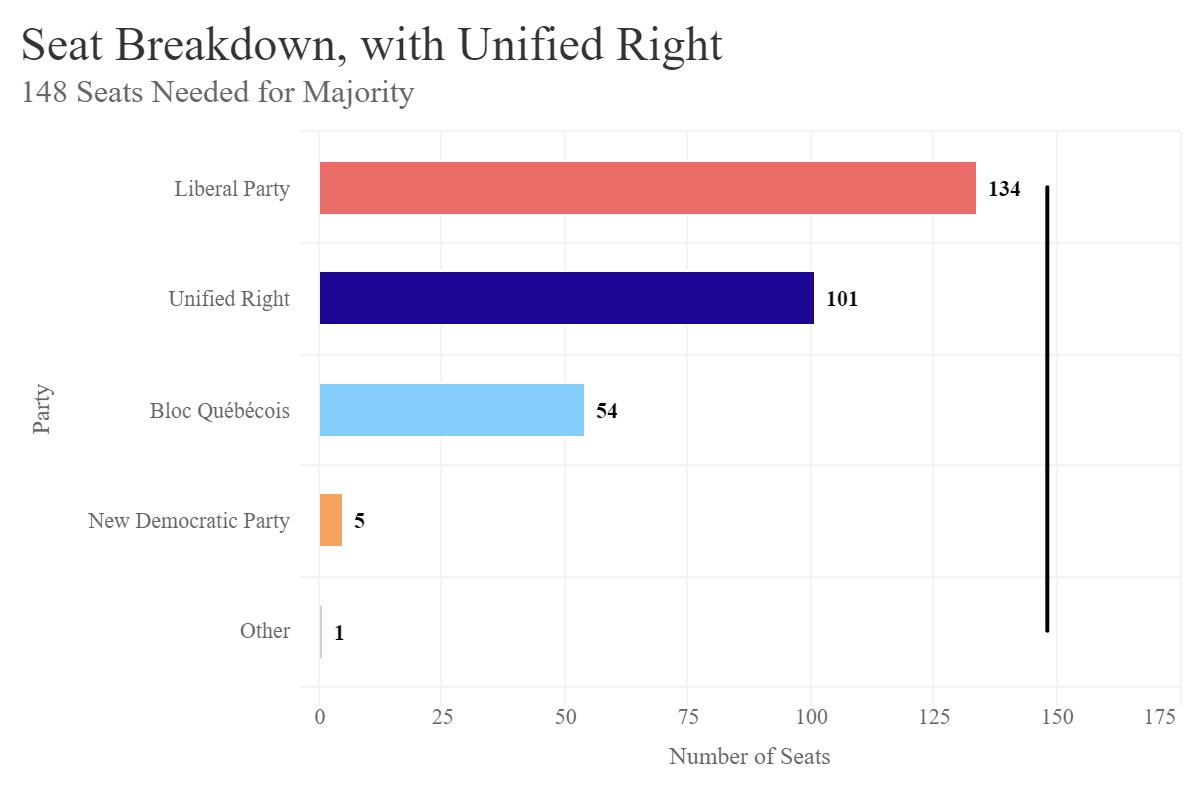
At face value, the results seem to imply that split vote changed the outcome of the election. With a combined right of centre vote, the Liberals would not have gotten a majority, though still had a plurality of seats. This would also create a situation where either the Liberals or a unified right could have theoretically governed, depending on who the Bloc chose to give their support to (which could have had pretty big implications for the Québec Independence Referendum, should it still happen).
However, as mentioned, I don’t think this view of the results should be taken at face value. Instead, I’ll be looking deeper into the patterns of Canadian voters, to get a more contextualized view of the results.
Kim Campbell’s Starting Point
As mentioned, Kim Campbell had only been Prime Minister for 122 days at the time of the 1993 election. This is because she was appointed following the resignation of the previous Prime Minister, Brian Mulroney. While Brian Mulroney had led the Progressive Conservatives to large majority victories in the last two elections, he chose to step down in advance of the 1993 election. The reason for his resignation is very simple:
Brian Mulroney didn’t have a snowball’s chance in hell of winning a third term.
Whether it be the failed Meech Lake and Charlottetown Accords, the implementation of a national sales tax, short-sighted privatization, the early 1990s recession, or a variety of other factors, everyone seemed to have a reason to dislike Mulroney. To give a sample of the attitude of the country, take a look at this opinion poll taken a little over a year before Mulroney announced his resignation:
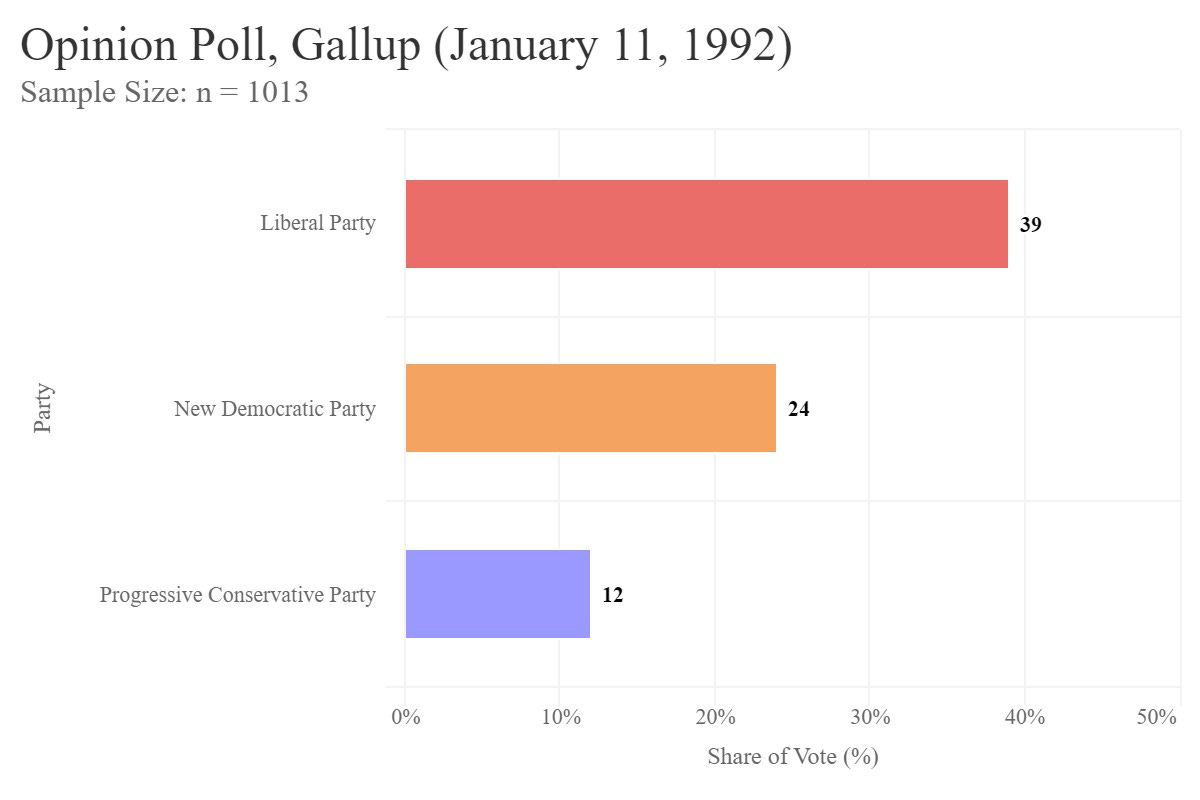
I highlight this poll because it excludes both Reform and the Bloc, meaning in a race among the same three main options people had in the last election (albeit with new Liberal and NDP leaders), only 12% of people wanted a third Mulroney term. While this was a particularly bad poll for the PC, looking at the rest of the pre-campaign opinion polling (i.e., polls taken after the 1988 election, but before the official start of the 1993 campaign), it wasn’t much of an outlier.
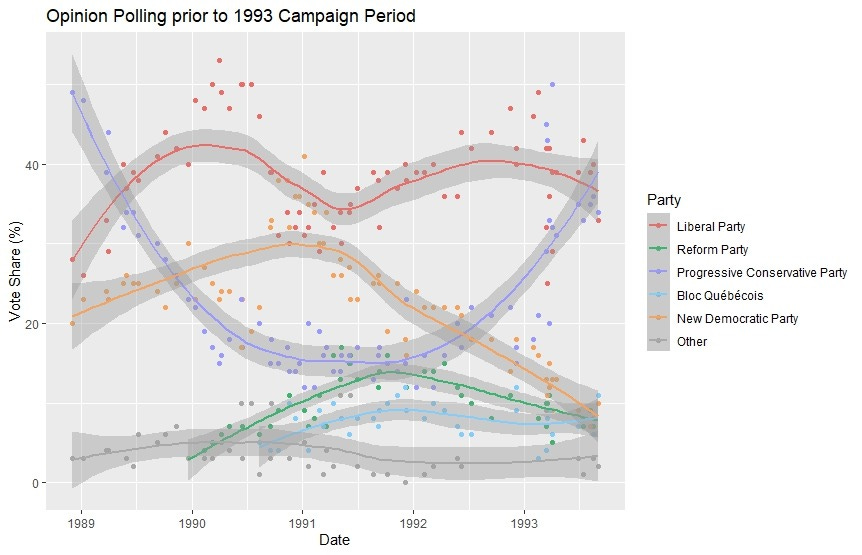
You may notice that near the end of the pre-campaign period, the PC suddenly surged to a surprisingly strong position, even leading in many polls. This happened around the time that Kim Campbell became the most likely successor to Brian Mulroney. For as much as Campbell is remembered as a “lost-cause” candidate, she actually started out as a relatively popular leader. As one example, this is a poll that was taken about two months prior to Kim Campbell being sworn into the premiership, which asked voters how they would vote with a hypothetical PC Leader Kim Campbell:
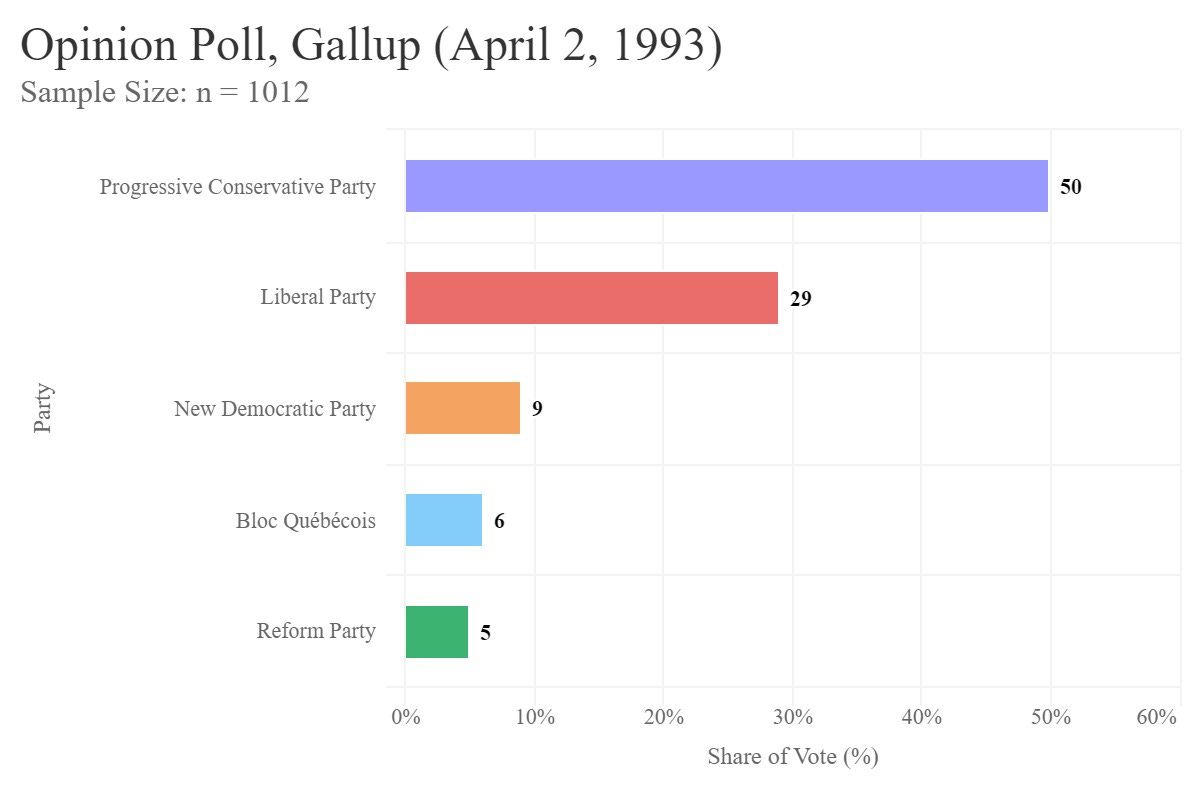
This would be an improvement for the PCs relative to their 1988 results, something that was unthinkable based on the trends just a couple months prior. I should say that strong polling like this is somewhat common for a new PM during their “honeymoon” phase, and I’m very skeptical that the PCs could have pulled off a result even close to this even under perfect campaign conditions. That being said, it does show that Campbell was at least starting off at a much stronger position than her predecessor was at the time of his resignation, and more importantly, shows an electorate more open-minded about her than the actual election results would lead you to believe. It seems like Canadian voters were willing to view Campbell as a break from Mulroney, and hear her make a case for their support.
So, what happened?
Face-off
Looking at the polls taken during the campaign period (i.e., polls taken after the election was officially called on September 8th, 1993), we can see that Kim Campbell maintained the PC’s relatively strong standing at the start of the campaign, with a roughly tied race.
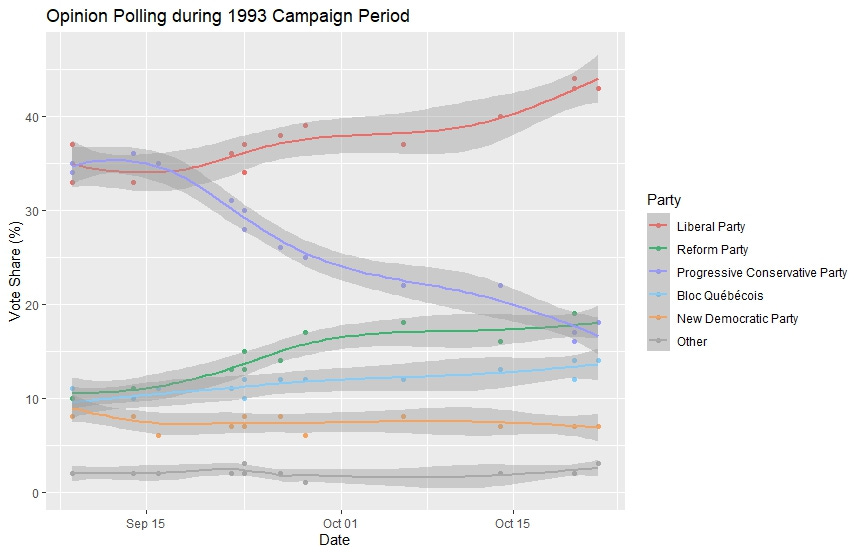
As the campaign went on, we can see the PCs in freefall, seemingly to the benefit of both the Liberal and Reform parties, before the PCs eventually land at third place in popular vote. To understand the shifts that took place among voters, I will be using the findings from a study published by the American Political Science Association, roughly one year after the election. Conducted by academics from several of Canada’s major universities, this study took data from the 1992-93 Canadian Referendum and Election Study, which compiled surveys of voters, both before and after the election, to analyze the changes in voting intention which occurred during the campaign.
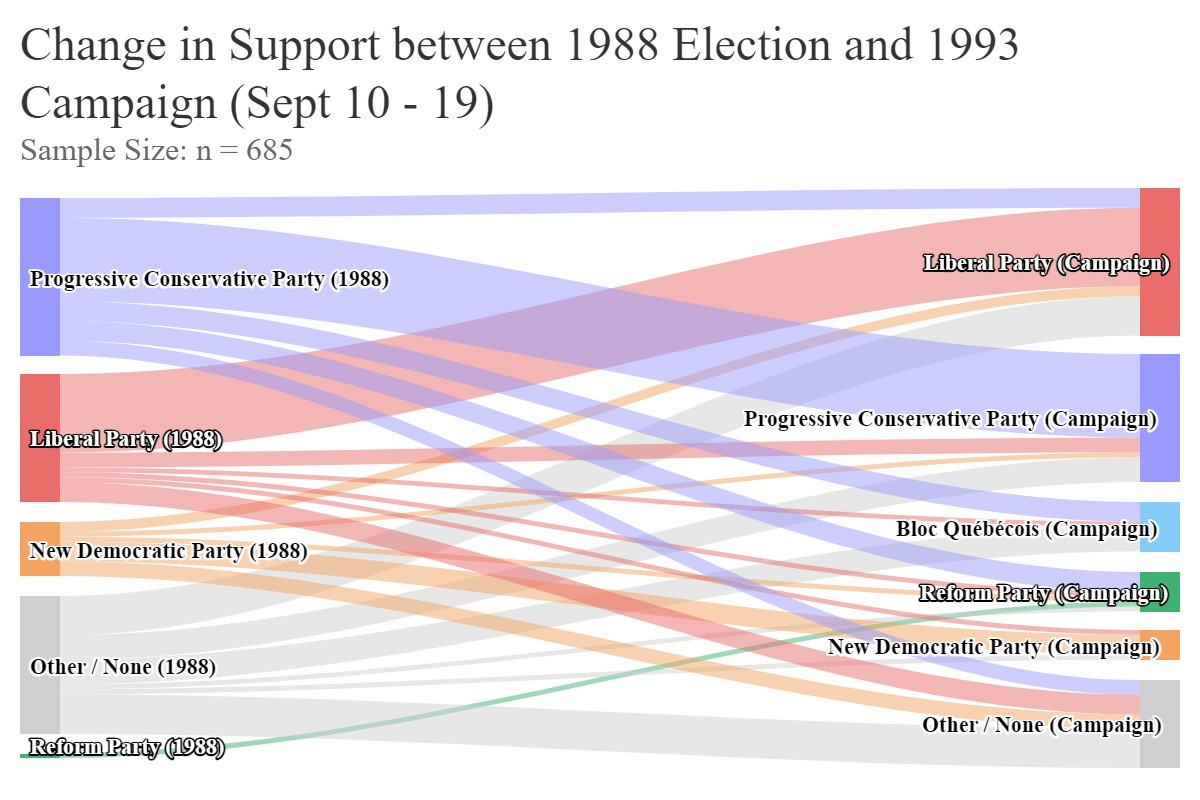
To start, one of the surveys studied, which occurred between September 10-19, 1993 (partway through the campaign), showed a Liberal lead of about four points (a lead consistent with other polling at the time), with the breakdown as follows: Liberals at 30 points, PC at 26, Bloc at 11, Reform at 9, NDP at 6, and Other / None at 18 (NOTE: inclusion of “None” in the survey is what artificially deflates the shares of each party relative to polls with only decided voters). What makes the survey interesting is that it included information on how respondents had voted in the 1988 election, so we can understand from (or to) whom each party was gaining (or losing) voters.
Based on the study’s analysis, compared to how the sample voted in 1988 (and accounting for weighting and inclusion of those who did not vote), the margin between the PC and Liberal parties had decreased by roughly ten points (meaning, an approximately six-point PC lead changed to a four-point Liberal lead). To understand the components which caused this change in margin, I have created a Sankey Chart to visualize how voters shifted among parties, and included a table with summaries of the impact of those changes on the margin.
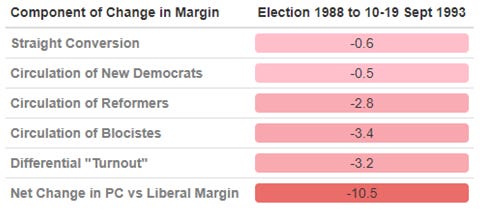
Each component of change in the table can be explained as follows:
Straight Conversion: This accounts for voters who directly switched from the PC in 1988 to the Liberals at this point in the 1993 campaign, or vice versa for 1988 Liberal voters. At -0.6, this component was surprisingly unimpactful, but as seen in the Sankey, the Liberals, at this point, had not swung that many former PC voters directly, and had even lost some to the PC.
Circulation of New Democrats: This refers to how 1988 NDP voters were intending to vote at this point. Normally, it would be expected that NDP voters would naturally switch to the Liberals due to them being the closest party to the NDP ideologically. Instead, while the Liberals were still the largest beneficiary of NDP decline, significant numbers of NDP voters also went to Reform and the PC (or didn’t intend to vote this time), so the effect on margin between the Liberals and PC was minimal.
Circulation of Reformers: This refers to which parties’ voters the Reform Party was gaining support from. While Reform took some amount of its support from all parties, at this point, former PC voters were by far the largest block, so this component significantly reduced the PC’s margin.
Circulation of Blocistes: This refers to which parties’ voters the Bloc Québécois was gaining support from. As seen in the Sankey, the Bloc got a large number of voters from None / Other (interestingly, the detailed findings of the survey found that just under 20% of the Bloc’s supporters had voted for the Rhinoceros Party in 1988), implying that their base was mostly those unhappy with the main options until this point. After this, the largest share was coming from former PC voters. This can be explained by the fact that the PC had done exceptionally well in Québec in both of Mulroney’s elections. However, the PC doing well in Québec was highly unusual. Aside from Mulroney’s two elections, John Diefenbaker’s 1958 national landslide was the only other federal election of the 20th century in which the PC finished first in Québec. This means that 1988 PC voters in Québec were likely very temporary supporters of the PC, rather than members of the party’s base, so it makes sense that PC voters be more open to switching to the Bloc than Liberal voters (who, given the Liberal Party’s long-held strength in the province, had likely been voting for the Liberals their entire lives, and thus felt more loyalty to the party). This made circulation of Blocistes the largest component of change in the PC’s margin at this point.
Differential Turnout: This accounts for how 1988 non-voters were planning to vote (if at all) at this point in the campaign. While most parties were net-benefiting from increasing turnout (i.e., the number of non-voters they were gaining was larger than the number of their 1988 supporters who intended not to vote this time), the Liberals were, by far, the largest beneficiary of this movement. As seen from the Sankey, aside from their own 1988 voters, the largest component of Liberal support at this time was coming from Other / None. With former non-voters coming out against the PC, this component had the second largest impact on margin at this point.
As seen from the Net Change in PC vs Liberal Margin, all of these components added up to over a ten-point drop in margin; this, in the survey’s findings, meant a four-point lead for the Liberals at this point. With circulation of Reformers only constituting about three points of this change, this means, even under the assumption that the PC would have absorbed all three points absent a surging Reform Party, their margin still would have been reduced by seven (meaning about a one-point Liberal lead at this point). In other words, even with the Liberals not really succeeding at this point in directly converting former PC voters to their side, other factors, besides split vote with Reform, were responsible for the PC being in a significantly weaker position than 1988.
To see how the situation changed in the remainder of the campaign, I have produced the same visualization and table, but showing how voters shifted between the time of the survey (i.e., September 10 to 19, 1993) and the actual election vote.
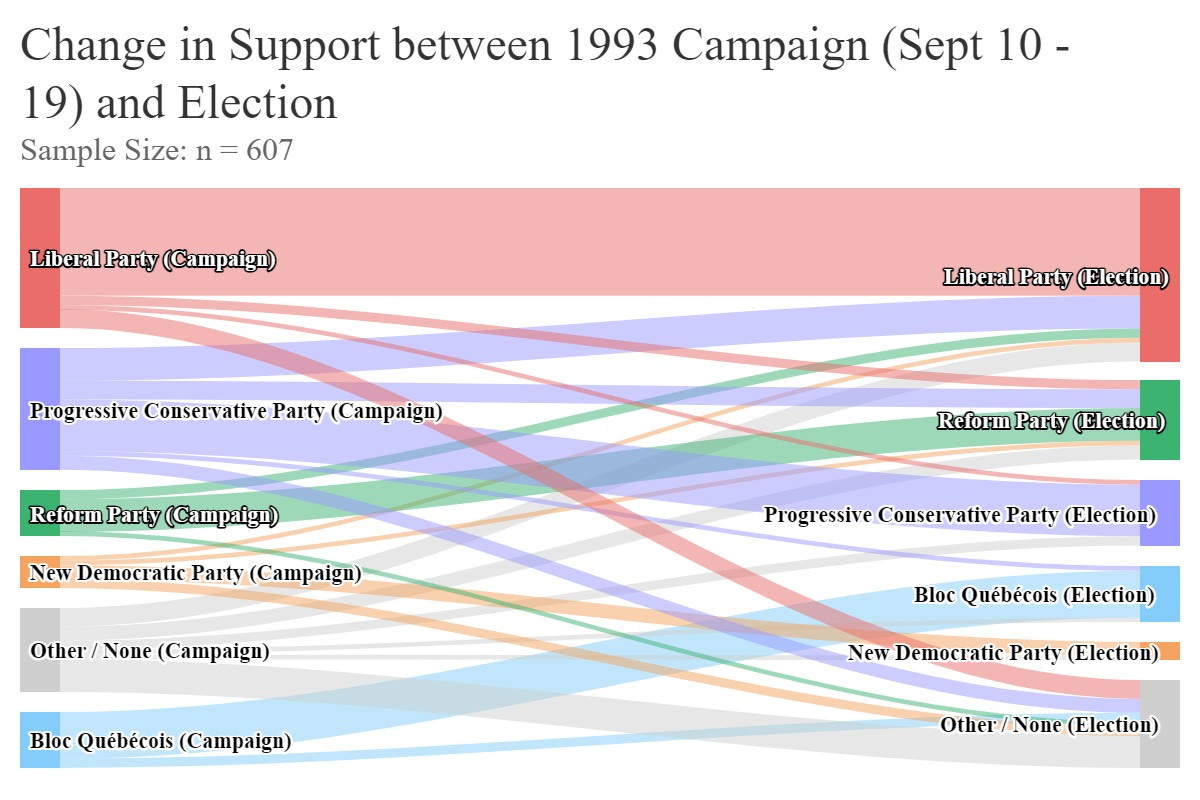
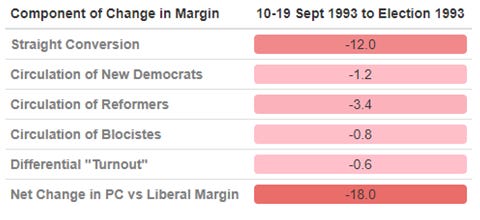
This is where most of the collapse in PC support occurred, and as seen from both the Sankey and the table, this was mostly due to the PC hemorrhaging large amounts of support to the Liberals. Since the period of the survey dates, the margin between the PC and Liberal parties dropped by a massive 18 points, and two thirds of this change was due to direct conversion between the two parties. While the Reform Party’s continued rise primarily hurt the PC, its effect was only just over a fifth of the overall change in margin.
The implication of these shifts is that, while the PC began in a competitive position at the start of the campaign, as the election date got closer, they sank to a worst-case scenario due to a loss of most, if not all, potential PC-Liberal swing voters to the Liberals. Taking a look at the campaign run by Campbell and her party, it’s not difficult to see why. The party seemed unwilling to give definitive answers or stances on questions relating to economic issues. At the start of the campaign, Campbell told reporters that it was unlikely that unemployment or the national budget deficit would be significantly reduced by “the end of the century”. She was reported later in the campaign to have said that “an election is no time to discuss serious issues”. At the leader’s debate, the other leaders made a point of questioning inconsistencies in the most recent federal budget, with Campbell mostly seen as dodging the question.
But the most memorable of her party’s faux pas and miscalculations was their decision to run what became known as the “Face Ad”.
In his youth, Jean Chrétien had suffered a Bell’s palsy attack which left one side of his face paralyzed. Having been an elected official for many decades, and been a very prominent cabinet minister in Pierre Trudeau’s governments, there had been a wealth of photographed public appearances in Chrétien’s life. As you can imagine, it’s not hard to find some photos of him where his facial paralysis is quite visible.
It should go without saying that, when running against someone with this condition, it would be in very poor taste to cherry-pick such images for an attack ad in a way that makes their facial paralysis a prominent focus, while narrators say things like “I would be very embarrassed if he became Prime Minister”. It should also be obvious that such an ad would only invite severe amounts of backlash from voters.
For then-PC Campaign Director, and future Toronto Mayor, John Tory, this was not obvious.
John Tory approved an ad doing exactly what I just described, which aired on October 14th, 1993, and received such severe backlash that it was pulled within a day.
It’s unclear what the exact impact of the ad on the election results was. The PC dropped further in the polls following the ad, but they had already been in freefall before. However, I highlight this ad because it’s indicative of what sank Kim Campbell and the PC from their competitive starting point. Campbell was able to give the party signs of life at the start of the campaign because she was seen as a fresh break with none of the baggage from her predecessor. Voters could also see themselves supporting her if she made a good case to them. Instead of making this case, she and her party ran a disastrous campaign which created new baggage, and only reminded voters of the type of party and government they had come to despise prior to her ascension to its leadership. Even with the losses the party had seen to Reform and the Bloc, if she had run a campaign which convinced even a significant amount of PC-Liberal swing voters to stay with her, the PC would have at least done well enough to remain a major party and rebuild in future elections.
With that out of the way, what about those defections to the Reform Party?
The True Impact of the Right-Wing Split
As we saw from the movement of voters throughout the campaign, while the largest block of Reform voters were PC voters in 1988, Reform was also pulling from the other parties. The same study I used before also looked at voter data from a larger sample, directly analyzing the shifts which occurred from the 1988 to 1993 elections. I have visualized them similarly to the campaign survey date.

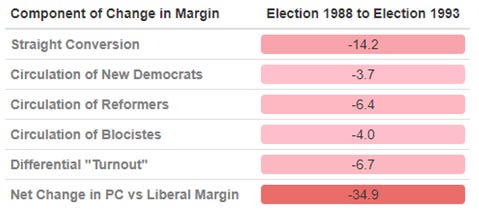
Using the data which informed the Sankey and table, I focused on the 1988 origins of 1993 Reform voters, and calculated a rough approximation of distribution as follows:
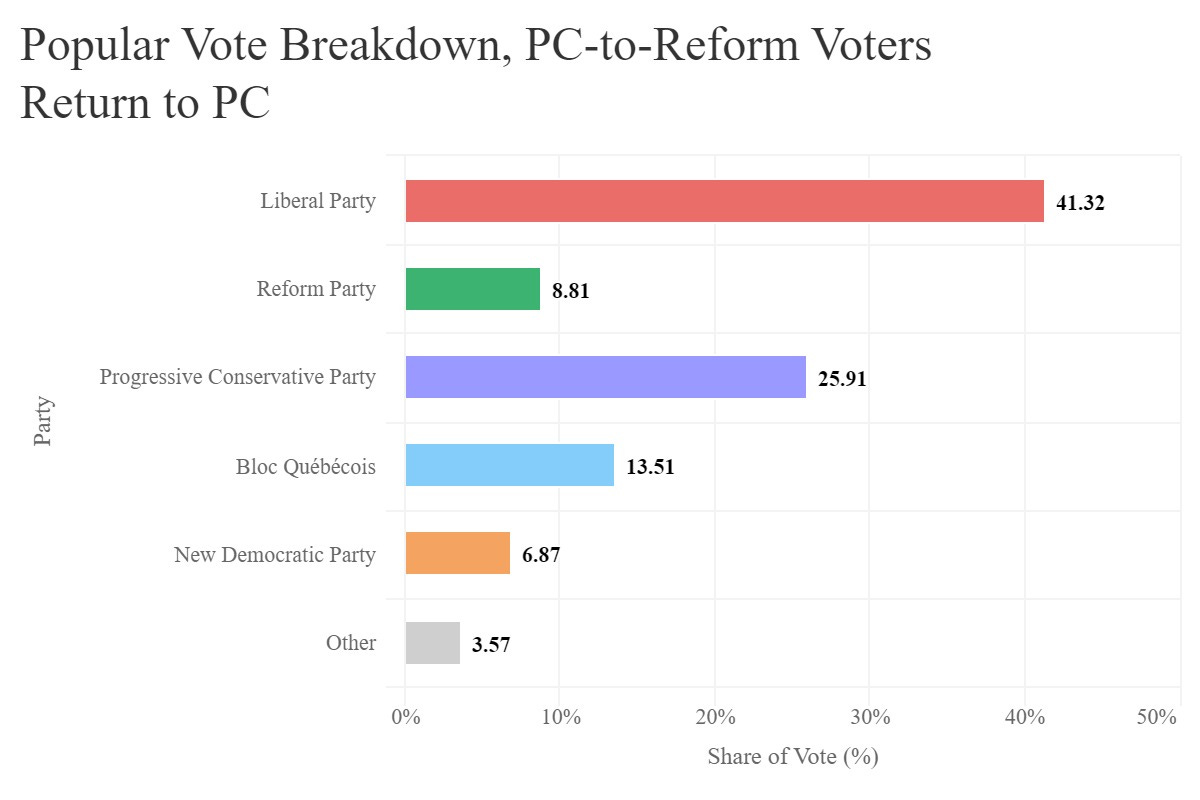
52.94% came from the PC, 11.76% from each of the Liberals and NDP, and 5.88% were people who voted for the Reform Party in 1988 and came back in 1993. The remainder (17.66%) were listed as Other / None in 1988.
If it is indeed true that the rise of the Reform Party, and the resulting PC defections and split vote with Reform, was the main cause of the Liberal Party’s majority victory, reallocating the Reform Party’s voters to their previous patterns should reduce the Liberal Party’s standing by enough to deprive them of a majority.
To create such a scenario, I have recalculated the results of the 1993 election, but with the Reform vote redistributed to the patterns their voters demonstrated in 1988. This means that in every riding where the Reform Party ran a candidate, I reallocated 52.94% of their votes to the PC candidate, 11.76% to each of the Liberal and NDP candidates, and left the Reform candidate with 5.88% of their actual vote total (for the remainder that would go to Other / None, I simply subtracted it from the total, as if those voters had not actually voted). It should be noted that the Reform Party didn’t run any candidates in Québec, so the results of all Québec ridings didn’t change.
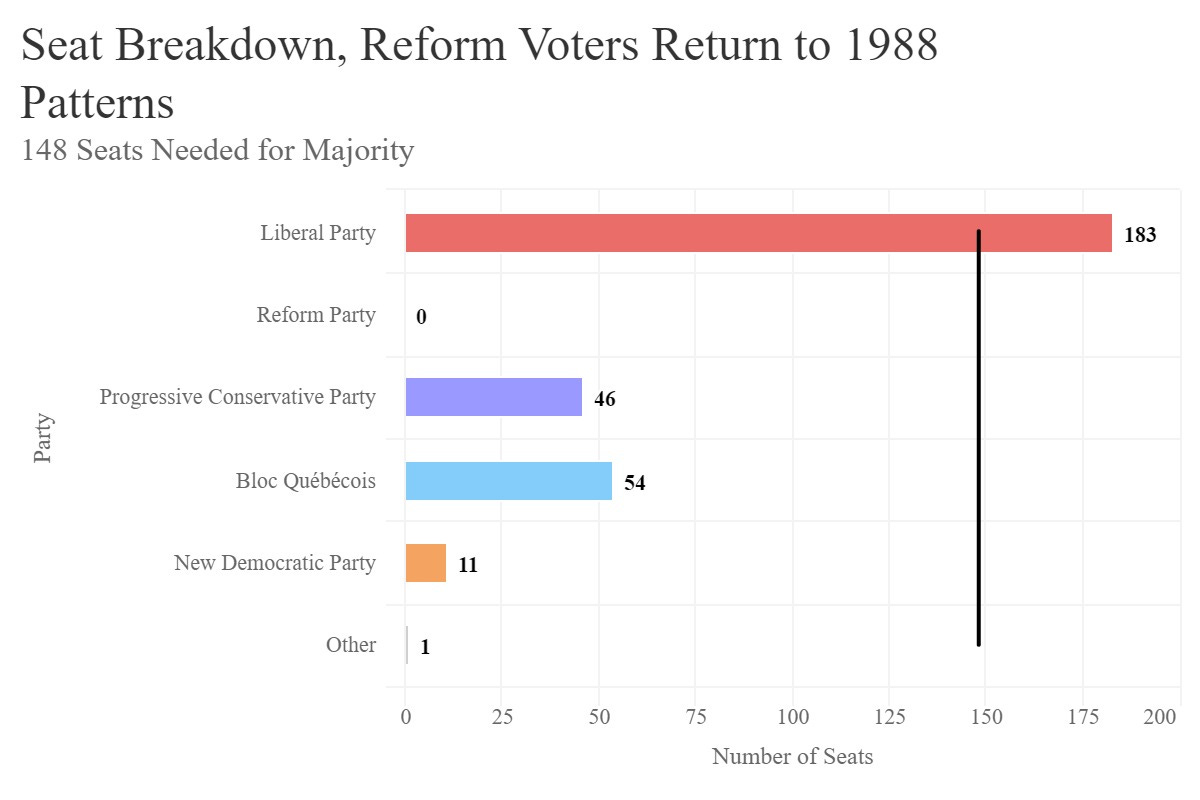
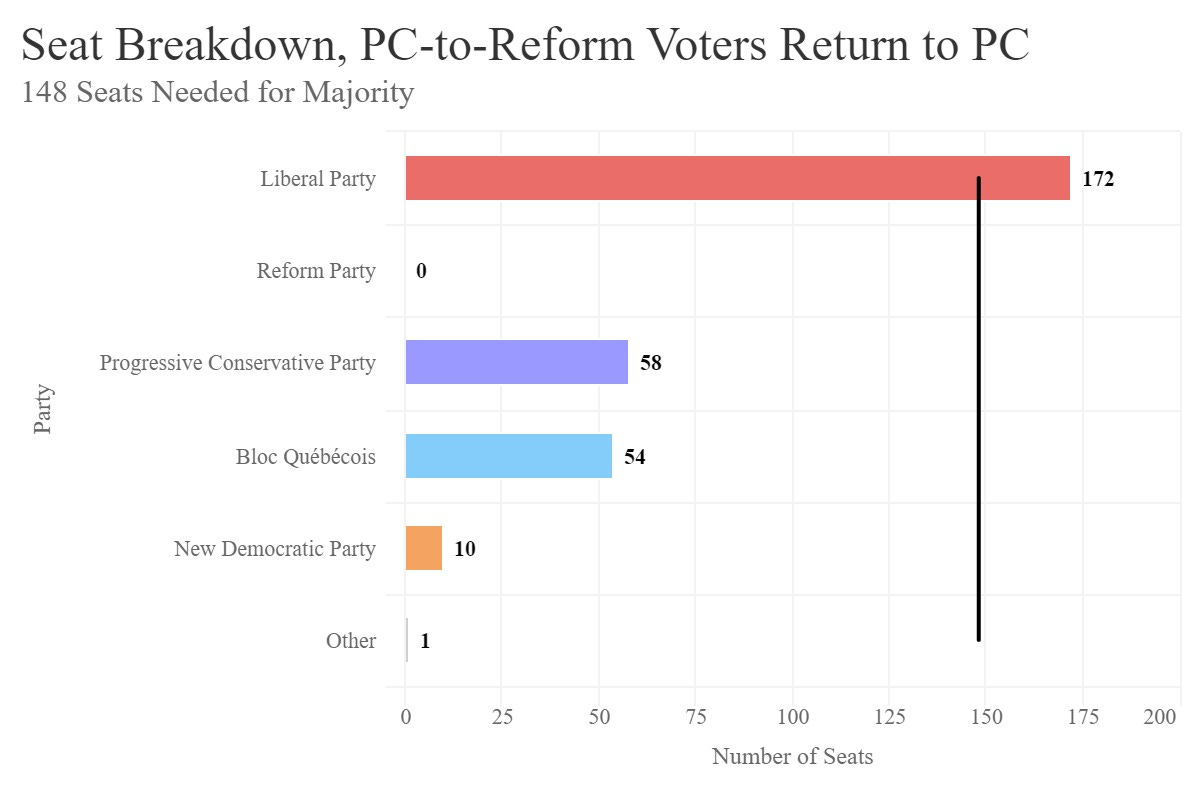
Recalculating the results in this way, the scenario can be summarized as follows:
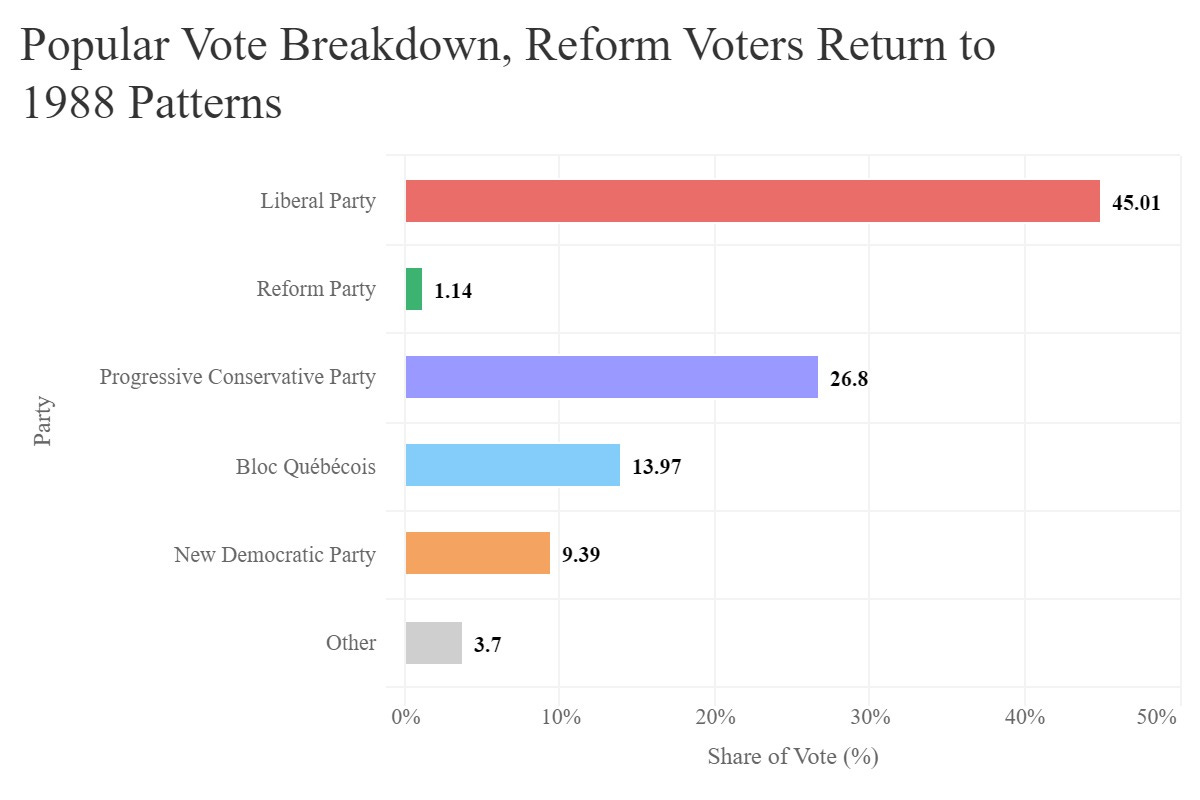

I should say that as someone who has long been interested in the 1993 election as a turning point in Canadian politics, I had my suspicions that the effect of vote splitting on the right was always overstated. I knew it was highly-questionable to assume that voters would consolidate if only offered one option, and it seemed clear that some Reform voters had come from places other than the PC. While I made sure to keep these assumptions out of my methodology and try to let the data speak for itself, I expected with a large amount of confidence that once I had recalculated the results based on available data, it would be found that reallocation of Reform voters would not cost the Liberal Party enough seats to take away their majority.
I never once suspected that any scenario in which Reform voters were reallocated would result in the Liberal Party gaining seats.
I also thought that the PC would at least gain enough seats to be the official opposition, yet the Bloc still takes that title in this scenario.
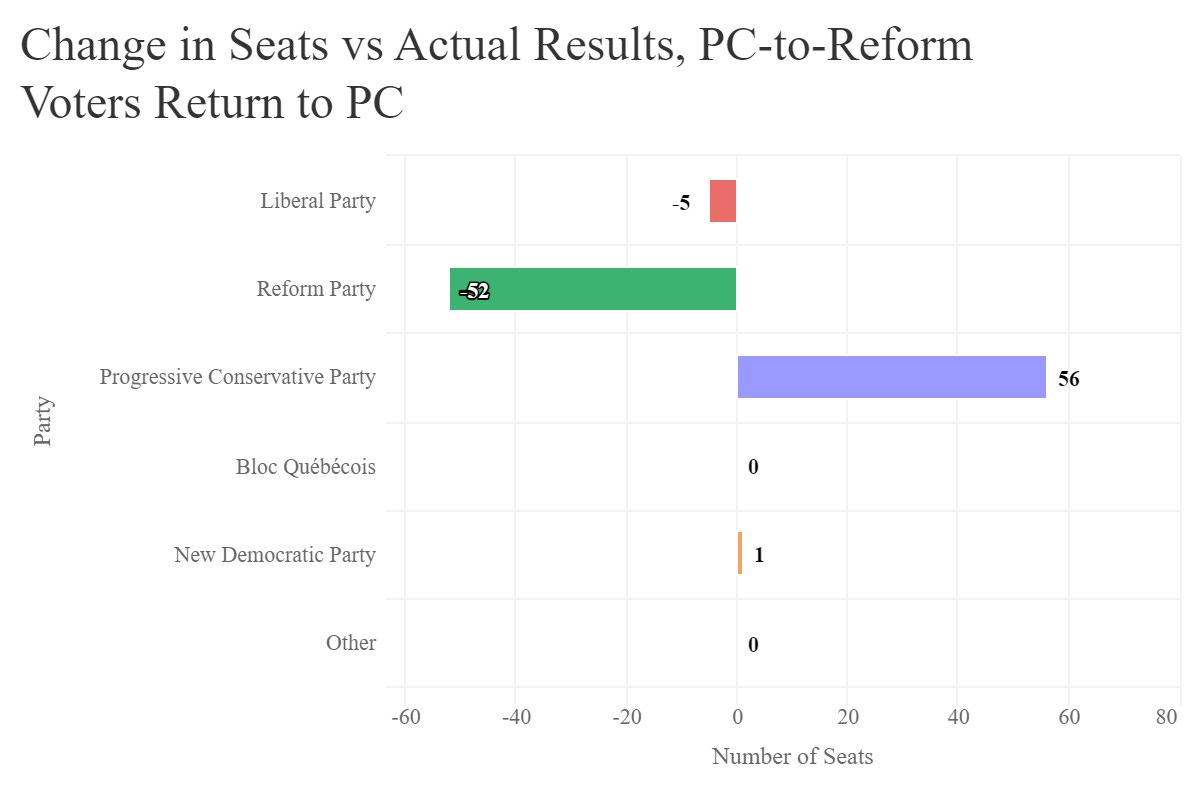
This scenario results in a total of 58 seats changing hands compared to the actual results, with the net changes summarized below:
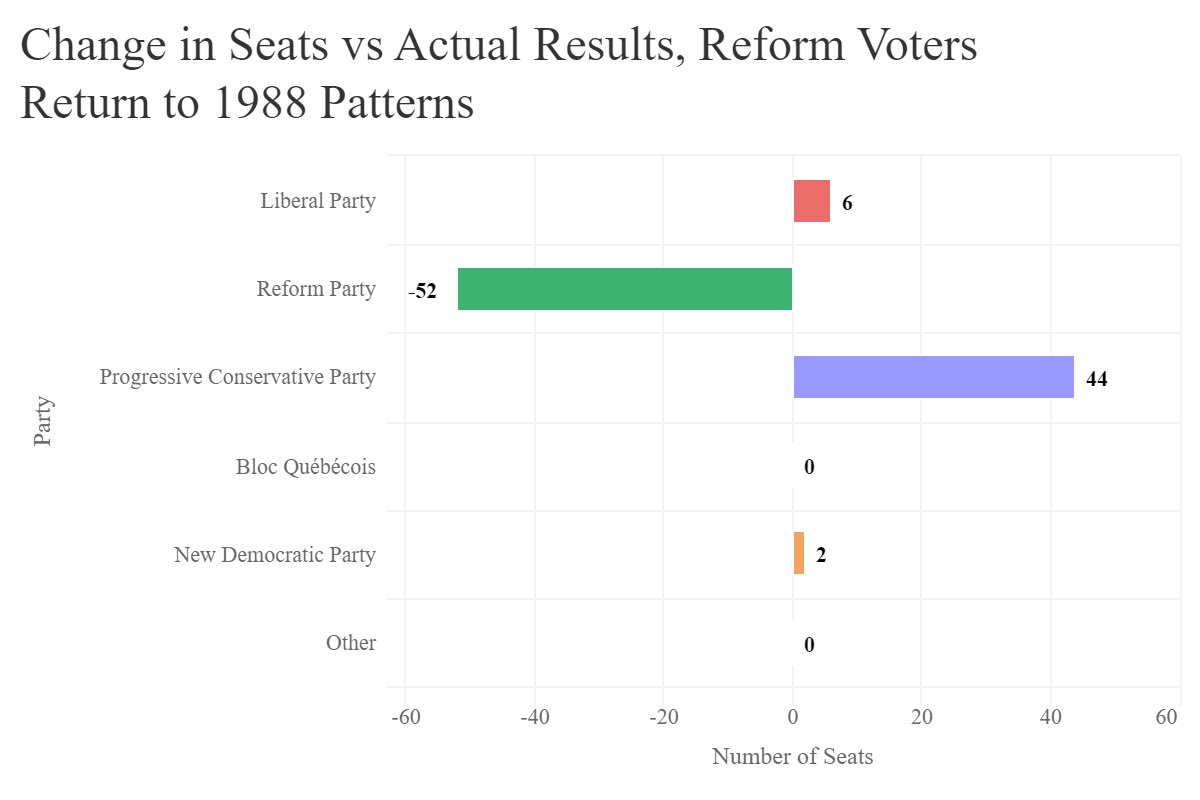
Of the 58 seat changes, 38 are the result of Reform seats switching to the PC. The table below shows the remaining 20:
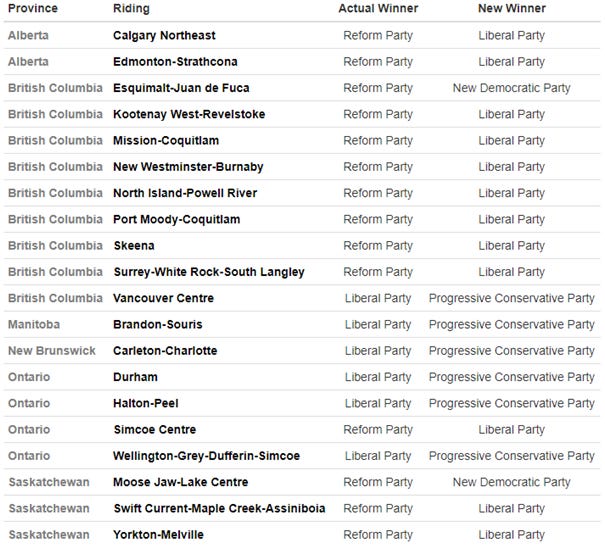
You may notice that many of these seats are in BC, a province the Reform Party did particularly well in. Zooming the map onto this province highlights something interesting.


A bird’s-eye view of the province, with the actual results on the left and the new scenario results on the right, shows that while the PC were able to retain many Reform ridings in the BC Interior (a historically very conservative area) under this scenario, the Liberals were able to flip many ridings on the coastline and Vancouver Island, with the NDP also flipping a riding on the island. This effect can also be seen when zooming in further to the Greater Vancouver Area (GVA).


In the metro area, we see more ridings flip from Reform to Liberal, though interestingly, the riding of Vancouver Centre flips from Liberal to PC. This was Kim Campbell’s riding, meaning she actually remains in Parliament under this scenario.
Ironically, Kim Campbell’s riding helps explain why the PC didn’t do nearly as well as one might expect when the Reform vote is redistributed. Campbell, despite losing her seat in the actual election, was able to finish in a relatively strong second place. This means that she didn’t need to flip too many Reform voters in order to win. In most ridings, this was not the case. In the actual election results, aside from the two ridings that the PC actually won, only 77 PC candidates finished second in their riding. Most PC candidates finished third, if not lower. This put the PC in such a weak position in most ridings, that unless they were receiving most, if not all, of the Reform vote, no reallocation would be enough for them to defeat the Liberal or New Democrat in their riding (especially if those parties are also getting some amount of Reform voters from reallocation).
The results of this scenario should prove that split vote did not hand the Liberals their majority, but I will emphasize this point further. I calculated a similar scenario, but with a twist: I reallocated the PC-to-Reform voters back to the PC, but I kept the rest of the Reform vote constant. This means that in any riding where the Reform Party ran a candidate, I took around 52.94% of their vote and gave it to the PC candidate, but the rest of the Reform vote remained with the Reform Party (i.e., Liberals and NDP do not receive their 11.76% of Reform voters).
In this scenario, which is intentionally favourable to the PC, let’s see if the new results cost the Liberals their majority:

By summarizing the net changes in seats, we can see that even this incredibly favourable scenario for the PC barely puts a dent in the Liberal Party’s majority (though it does grant the PC official opposition).
With these findings, it can be safely said that the surge in the Reform Party, and the perceived split vote on the right, was not a major factor in the Liberal Party’s majority victory. It was, however, a deciding factor in the PC losing its status as a major political force, and it resulted in the Reform Party replacing the PC as the dominant player on the Canadian Right for the next decade; something that likely had a much larger impact on Canada’s political culture than one election result.
Conclusions and Takeaways
With an understanding that there were far more important factors in the PC’s defeat and the Liberals’ victory than right-wing split vote, what lessons can political parties learn from this election?
Firstly, don’t assume that a perceived split vote is a major factor in a party’s poor position. There is no way to know for sure that voters of one party would vote for another, or a merged party, if their preferred party weren’t an option. There has long been discussion in Canada about the role of left vote splitting between the Liberals and NDP, and this assumption is just as faulty there as it was with discussions of the Reform Party. Just like how not all Reform voters were natural PC voters, not all NDP voters should be seen as natural Liberal voters, and vice versa.
Secondly, rather than being a doomed strategy, replacing an unpopular leader with a fresh face can breathe new life into a party’s electoral prospects. When governing parties in Canada and its provinces are polling poorly, there is usually discussion around whether they should replace their leader, or stick with the incumbent leader, even if said incumbent is unpopular. This has been the case most recently in discussions around the federal Liberal Party, and whether they should replace Justin Trudeau in time for the next election. There is often a sense among some that it isn’t sensible to put someone new in the leadership just to be that election’s “Kim Campbell”. The problem with this logic is that Kim Campbell didn’t need to be her election’s “Kim Campbell”. She started out in a much stronger position than anyone thought her party was capable of at the time, and could have done significantly better than she did had she run a campaign that successfully took advantage of this strong position.
Lastly, and related to the second point, campaigns matter. Looking at how dramatically the poll positions of the main parties shifted from direct conversion of swing voters, a party should not take a strong position at the start of a campaign for granted. Likewise, a party currently behind can gain ground if they run an effective campaign.
It’s difficult to define an “effective” campaign, but it likely avoids running attack ads which highlight any physical deformities their opponent may have.